Charts for slides and reports
Export vector charts from saved evidence, choose a fixed theme, and keep the statistical context.
Zenbench already produces standalone SVG charts and self-contained HTML reports. You can export them from a saved native Rust suite packet without compiling or running the benchmark again. SVG stays sharp when resized in a slide or document. The commands below describe the current Git version.
Export a report or a standalone chart
# One HTML file with inline charts and expandable statistics.
zenbench data read candidate.json.gz --format html > report.html

# One standalone SVG per comparison group.
zenbench data read candidate.json.gz --save-charts figures
The reader accepts suite JSON, gzip JSON and evidence references. --save-charts
uses the built-in renderer and does not need the optional charts feature.
A group needs at least two benchmark entries to produce a comparison chart.
Exports do not modify the packet. Keep the packet and its build/input provenance
with the exported files.
These renderers currently accept native suite evidence, not external pair
packets or fleet observations. For those, export their selected data and preserve
the distinct statistical units and validity labels in your plotting tool. Do not
convert a pair packet into a suite packet to get a chart.
Choose a fixed theme for slides
Enable the optional renderer when installing the current CLI:
cargo install --git https://github.com/imazen/zenbench --locked --bin zenbench --features charts
zenbench data read candidate.json.gz --publish-charts slides-light --chart-theme light
zenbench data read candidate.json.gz --publish-charts slides-dark --chart-theme dark
zenbench data read candidate.json.gz --publish-charts slides-vertical --chart-theme light --vertical
The charts feature requires Rust 1.88 or later. Pin a reviewed Git revision with
--rev COMMIT for a reproducible tool installation. Horizontal bars suit long
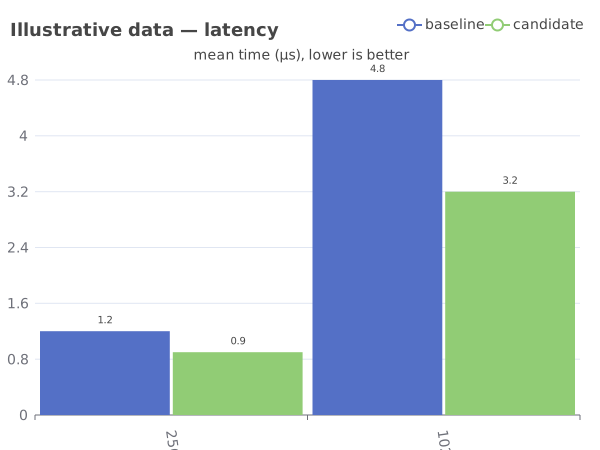
benchmark names; vertical grouped bars help compare a small set of workload sizes.
Benchmark names such as baseline/256 items and candidate/256 items, repeated
for another size, form a grouped chart automatically.
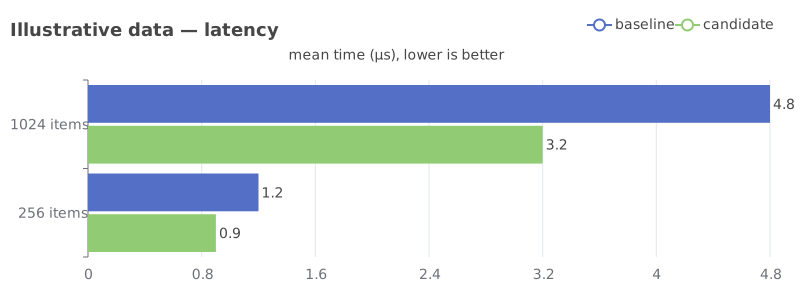
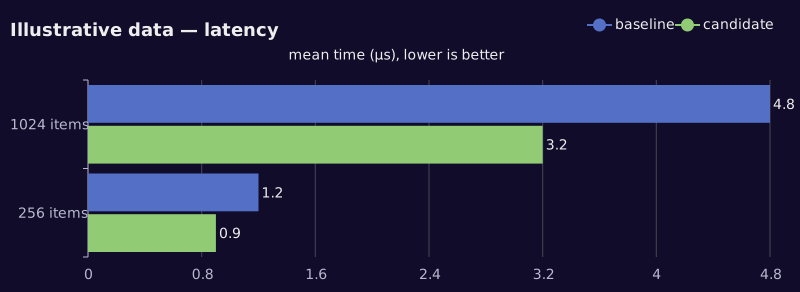
The following previews come from the actual renderer. All values are illustrative, not measured performance. Download an SVG to try inserting it into your slide editor:
Light background
Dark background
Vertical grouped bars
Insert the downloaded file as an SVG image in a slide editor that supports it; resize the vector instead of taking a screenshot of the terminal. Use a fixed light or dark export to match the slide background. Check label size at the final presentation scale. Keep a concise caption identifying workload, units, hardware, builds, sample unit and the source packet.
Keep spread and uncertainty distinct
The themed SVG bars show arithmetic mean latency, with lower values better. They do not display confirmation confidence intervals. The themed matrix renderer retains MAD values in SVG source comments; those comments are not visible whiskers. The built-in matrix export draws MAD spread indicators, which also are not confidence intervals. Its per-size scales require reading the size/axis labels; bar lengths in different sections are not a shared absolute scale.
An attractive mean bar chart alone cannot establish a speedup. Include the paired change interval, acceptance rule and validity verdict beside it when presenting a confirmed claim. Preserve invalid or inconclusive outcomes; avoid a caption that calls the fastest observed bar a confirmed winner. Read the methodology and confirmation guide before interpreting the visual.
Export from Rust
For an existing SuiteResult, the same renderers are available in the crate:
let result = zenbench::SuiteResult::load("candidate.json.gz")?;
result.save_charts("figures")?;
std::fs::write("report.html", result.to_html())?;

// With zenbench's `charts` feature enabled:
result.save_publication_charts(
    "slides",
    &zenbench::charts::ChartConfig::default(),
)?;
These lines belong inside your existing fallible function. The complete chart gallery example is runnable from a checkout and generates the illustrative light/dark/vertical previews without timing any workload:
just chart-gallery NEW_DIRECTORY
The separate QuickChart gallery shows URL-based chart themes. Those URLs send their embedded chart data to an external rendering service when fetched. Local SVG export keeps rendering offline. For retaining compact review records, continue with saved evidence.